PMBus Telemetry & Fleet Power Control
A power supply that cannot report is a component you can only trust blindly. Every intelligent TitanWatt unit implements PMBus 1.2 over I²C, so your BMC sees input and output voltage, current draw, internal temperatures and fan speed in real time — and can command the fleet, not just observe it. The same digital layer that streams telemetry also enables power throttling, cold-redundancy sequencing and active current sharing across an N+1 bank, turning a rack of supplies into one manageable power resource.
What the PMBus 1.2 Command Set Exposes
The register map below is implemented on our production 550W–2400W platforms and is the baseline we extend for project-specific commands.
| Group | Telemetry readable | Commands supported |
|---|---|---|
| Input rail | Vin, Iin, Pin, input status | READ_VIN, READ_IIN, READ_PIN, status query |
| Output rail | Vout, Iout, Pout, +5VSB | READ_VOUT, READ_IOUT, VOUT_COMMAND (within limits) |
| Thermal | Primary / transformer / output NTC temperatures | READ_TEMPERATURE_x, warning threshold set |
| Cooling | Fan speed RPM, fan-fail flags | READ_FAN_SPEED_1, fan curve configuration |
| Fleet | Unit present/absent, sharing state, fault log | OPERATION, on/off sequencing, current-share status |
Cluster-Level Power Management
Power Throttling
When a PSU drops out of an N+1 bank, the survivors signal remaining headroom over PMBus; the BMC can shed or throttle non-critical load instead of tripping the bank — graceful degradation instead of a 10kW+ GPU node going silent mid-training run.
Cold Redundancy
In cold-redundant fleets, standby units stay powered off and cool; PMBus sequencing rotates which unit carries load, so aging is spread evenly and the mechanical wear on fans and capacitors is distributed across the bank instead of concentrated on unit #1.
Active Current Sharing
Units in a bank negotiate load current over the digital bus, holding output balance tight without droop-style waste — the mechanism that lets a 7×24 storage array run two power paths at nearly equal stress, year after year.
Graphical Monitoring, No Driver Work Required
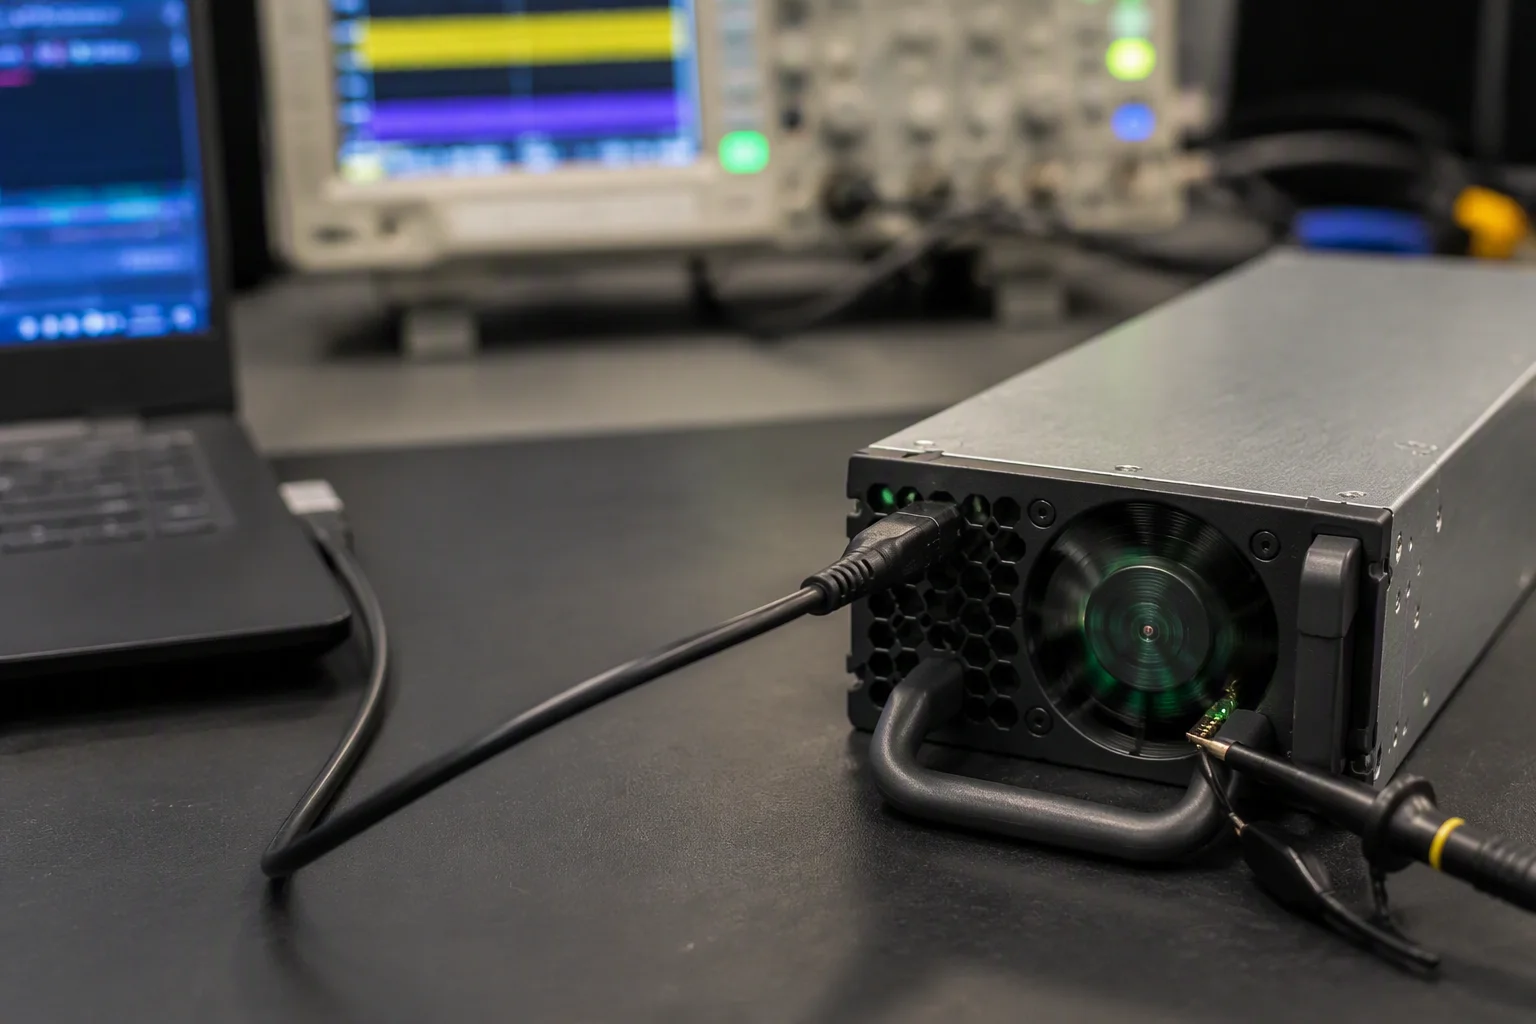
For lab bring-up, factory audits and field diagnosis, our graphical monitoring tool connects over a standard USB-to-I²C adapter and mirrors the same registers your BMC reads: live rail voltages and currents, temperature traces from the three NTC nodes, fan RPM and the latched fault log with timestamps.
The tool ships free to project customers and doubles as the configuration utility for custom fan curves and warning thresholds — the settings you tune in the lab are exactly what you can deploy at fleet scale through your own BMC integration.
Protection Interlock and Firmware Discipline
Digital control earns its keep at the protection boundary. OVP, UVP, OCP and OTP trip points are set in firmware but execute in hardware comparators, so a hung microcontroller cannot disable protection. Fan-fail detection is likewise independent of the telemetry path.
Firmware is version-controlled per platform with signed images; field updates go through your BMC over the PMBus interface, and every shipped unit carries a serial-tied firmware record so a fleet audit can reconstruct exactly what is deployed — one more line of defense behind the 250,000-hour MTBF figure.
Tested Against Real BMCs
Telemetry only helps if your baseboard controller trusts it. We validate every PMBus implementation against common BMC platforms — threshold behavior, word format, fault propagation — so integration is a configuration task, not a debugging project.
PMBus Integration FAQ

Get the Register Map Before You Commit
Request the PMBus command documentation and GUI tool with your inquiry — we reply within 48 hours with the map matched to your wattage segment.