PMBus on Server PSUs: a Working Guide
Every intelligent CRPS unit on the market claims PMBus support. What separates a useful implementation from a checkbox is which registers are exposed, how thresholds are set, and whether your rack manager can act on what it reads. This is the integration view.
What PMBus 1.2 Actually Gives You on a PSU
PMBus is a command language layered on I²C. On a server power supply it does two jobs, and buyers routinely conflate them. The first is observation: input and output voltage, current and power, internal temperatures, fan speed, and a latched fault log with timestamps. The second is control: on/off sequencing, output voltage setpoint adjustment within limits, warning-threshold writes, fan-curve configuration, and power-throttling coordination across a bank.
The observation half is what gets specified. The control half is what actually changes how a rack behaves under a fault, and it is the half that has to be validated before deployment. A unit that reports beautifully but cannot be sequenced cleanly across a hot-swap event is a monitoring device, not a manageable power resource.
All intelligent TitanWatt units implement PMBus 1.2 over I²C across the production 550 W–2400 W range, and the same command set is the telemetry target for the 3000 W–5500 W M-CRPS program. Basic non-PMBus variants remain available on the 550 W–1300 W enterprise segments, because plenty of 1U and 2U chassis only need DC-OK and PS-OK signalling and should not pay for telemetry they will never poll.
The Registers Worth Polling
PMBus defines far more commands than any fleet actually uses. In practice, four groups carry the diagnostic value, and a fifth carries the fleet-level state your rack manager needs. This is the map we implement and extend per project:
| Group | Read | Commands | Why it earns a poll slot |
|---|---|---|---|
| Input rail | Vin, Iin, Pin, input status | READ_VIN, READ_IIN, READ_PIN | Catches brownout, phase loss and PDU-level faults before they become output events. |
| Output rail | Vout, Iout, Pout, +5VSB | READ_VOUT, READ_IOUT, VOUT_COMMAND | Load-share balance is the single best health indicator on a redundant bank. |
| Thermal | Primary, transformer, output NTC temperatures | READ_TEMPERATURE_x | Three nodes separate an airflow problem from a component problem. |
| Cooling | Fan speed RPM, fan-fail flags | READ_FAN_SPEED_1 | RPM creeping up at constant load is the earliest warning a PSU will give you. |
| Fleet | Unit present/absent, sharing state, fault log | OPERATION, on/off sequencing, share status | Tells the rack manager how many healthy paths remain, not just how one unit feels. |
If you take only one line from that table, take the fan register. A fan spinning 15% faster this week than last week at identical output current is a blocked inlet, a dust-loaded mesh or a bearing on its way out — all three are serviceable on a scheduled window, and all three become a thermal trip if nobody is watching.
Polling Cadence and Bus Budget
PMBus shares an I²C bus, and a power shelf can carry a lot of listeners. A 33 kW shelf is six hot-plug modules, and a rack may hold several shelves; a storage enclosure can present a full row of supplies on one management bus. Polling everything at once is the fastest way to make a good implementation look unreliable, because bus contention shows up as read timeouts and dropped samples that get misread as unit faults.
A 10–30 second interval per register group is the practical band. Faster polling buys nothing operationally: thermal and wear-out trends move over hours and days, not milliseconds, and the events that genuinely need millisecond response — overcurrent, overvoltage, over-temperature, fan failure — are handled by the unit's own hardware protection, not by your polling loop. Where you do need fast reaction, use the fault flags and the unit's protection trip rather than a tight read loop.
Structure the reads so the heavy registers are staggered across units. Reading Vout and Iout from six modules in the same 100 ms window creates a burst that serves no analytical purpose. Round-robin the modules, aggregate on the shelf controller, and let the manager consume one consolidated snapshot per slot.
Warning Thresholds Come Before Fault Thresholds
A protection trip is an outcome, not a diagnostic. The value of PMBus is that it lets you set a warning limit well inside the fault limit, so a degradation trajectory produces a logged event with weeks of lead time instead of a replacement order with none.
- Temperature: set the warning threshold at the point where the unit is still comfortably inside its continuous rating but has lost margin to the derating curve above 45°C.
- Fan speed: warn on rate of change at constant load, not on an absolute RPM. An absolute limit catches a dead fan; a trend limit catches the week before.
- Output current: warn when one module in an N+1 bank carries meaningfully more than its share. Persistent imbalance is the first sign of a sharing loop going soft.
- Input voltage: warn on sustained low-line operation, because efficiency curves are specified on the 230 V line and low-input operation derates output.
Note where protection actually executes. On our platforms the OVP, UVP, OCP and OTP trip points are held in firmware but executed in hardware comparators, so a hung microcontroller cannot disable them, and fan-fail detection is independent of the telemetry path. That separation is deliberate: telemetry is a management layer, not a safety layer, and the two should never share a single point of failure.
Integrating PSU Telemetry into Rack Management
The integration goal is that a PSU event appears on the same timeline as every other component event, with the same severity vocabulary. Three patterns cover most deployments.
Threshold alerting. Your BMC polls the register groups above, evaluates warn and fault limits, and logs a degradation event. This is the minimum viable integration and it is where most fleets should start.
Throttle coordination. When a module drops out of an N+1 bank, the survivors signal remaining headroom over PMBus; the BMC sheds or throttles non-critical load instead of letting the bank trip. On a 10 kW+ GPU node this is the difference between a degraded training run and a dead one. We provide the register map and reference logic so the throttle decision stays on your side of the interface.
Wear rotation. In cold-redundant schemes, standby units stay dark and cool while PMBus sequencing rotates which module carries load, spreading fan and capacitor wear across the bank instead of concentrating it on unit one. In active arrays, use the same telemetry to rotate the load-share lead.
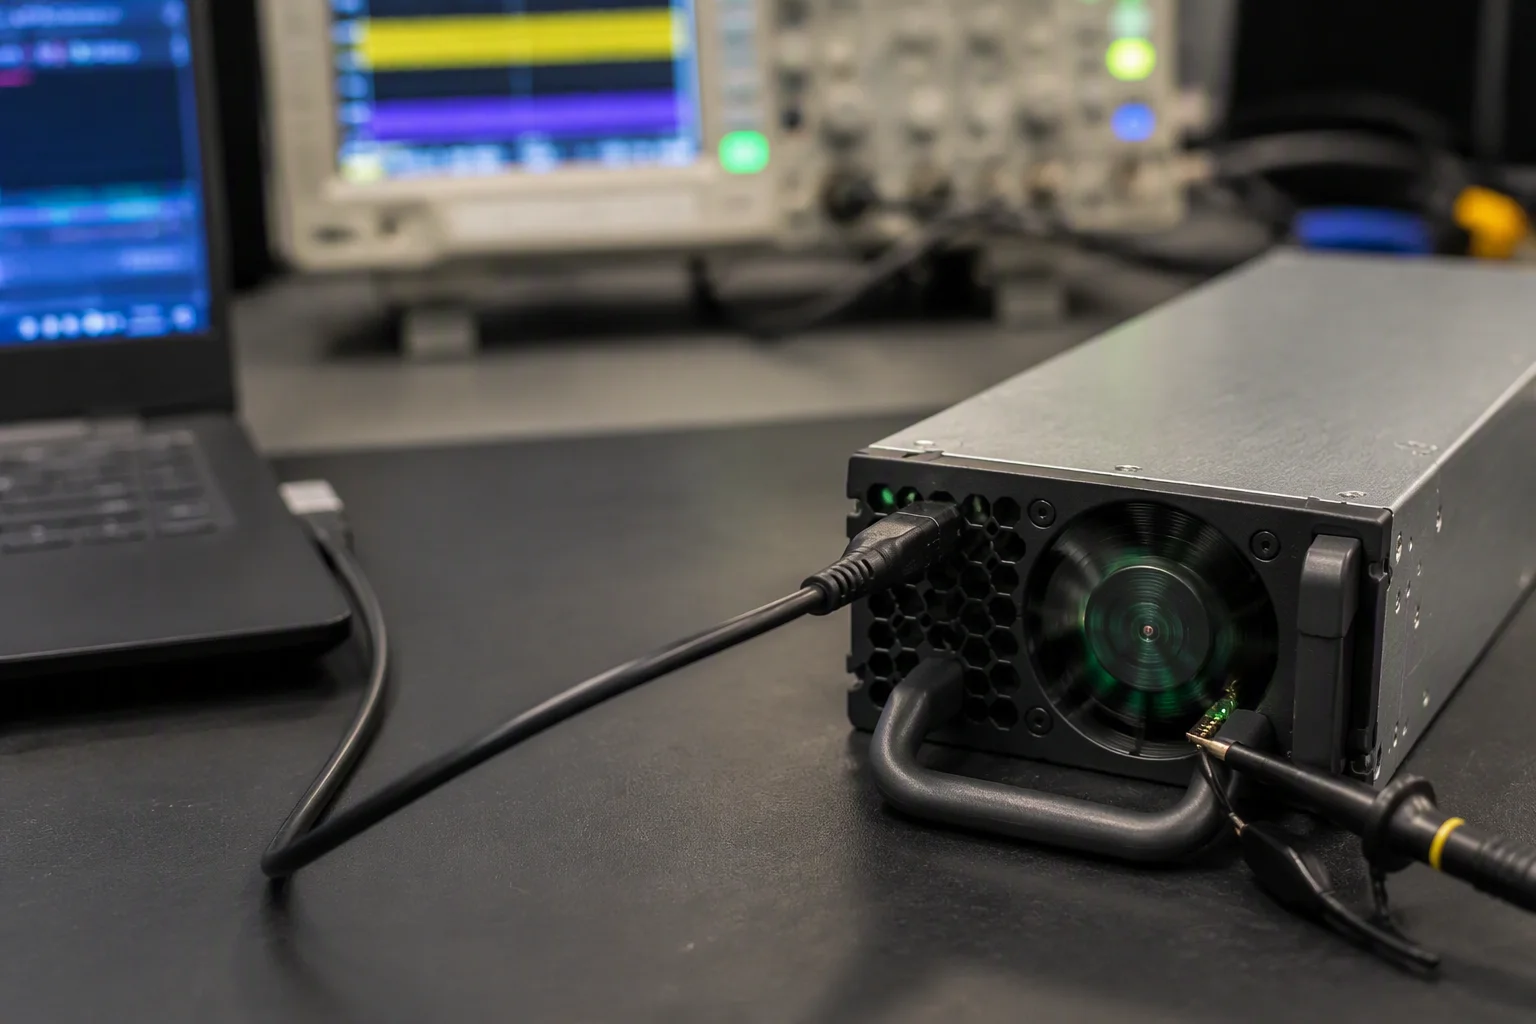
Telemetry only helps if your baseboard controller trusts it, so validate the implementation against your actual BMC stack — threshold behaviour, word format, fault propagation — rather than against a lab adapter. We run that validation against common server management platforms as part of integration support, because a register map that reads correctly on a bench tool and incorrectly in a BMC is a debugging project nobody budgeted for.
A Bring-Up Sequence That Catches Integration Bugs
Run this on one unit before scripting anything across a fleet. It is short, and it is the sequence that finds the faults that otherwise appear in production:
- Confirm the unit is discovered at the expected I²C address in the slot you intend to use, with the shelf controller's slot addressing applied.
- Read every register group once and confirm the values are physically sensible — Vout within tolerance, Iout matching your electronic load, fan RPM non-zero, temperatures tracking your chamber.
- Write each warning threshold, then read it back. A threshold that will not persist across a power cycle is a threshold you do not have.
- Verify PS-ON and PS-KILL behaviour and timing, including recovery after a kill command, and confirm POK/PWR-OK polarity against your own schematic.
- Force a fan-fail and an over-temperature condition and confirm the flag, the log entry and the BMC event all appear on one timeline.
- Record the firmware version reported by the unit and confirm it matches the version on the shipment documentation.
- Pull one module from a live bank at load and confirm the survivors report the new share state and the array holds output.
What to Ask For With the Sample Kit
Telemetry is a documentation deliverable as much as a hardware one. Ask any supplier for the PMBus command documentation matched to your wattage segment, the register map with word formats and scaling, the warning-threshold defaults, the latched fault-log layout, and a statement of which commands are writable versus read-only. Ours ships with project samples along with a graphical monitoring tool that connects over a standard USB-to-I²C adapter and mirrors the same registers your BMC reads — useful for factory audits and field diagnosis as well as bring-up.
Also ask how firmware is controlled. We version-control firmware per platform with signed images, tie a firmware record to each shipped serial number, and support field updates through your BMC over the PMBus interface. That record is what lets a fleet audit reconstruct exactly what is deployed, months after the fact — one more line of defence behind the 250,000-hour MTBF target at 40°C per Telcordia SR-332. Samples of our production 550 W–2400 W range ship in 2–4 weeks with full test data, and the 3000 W–5500 W M-CRPS telemetry set is open for joint definition with development partners.
Related Reading
N+N and N+1 Sizing Without Guesswork
How many supplies per shelf, what load sharing really costs, and derating at temperature and altitude.
Read →The CRPS Mechanical Envelope
What 73.5 × 40 × 185 mm constrains, including the I²C and PS-KILL pins your BMC depends on.
Read →PMBus Telemetry & Fleet Power Control
The full command set, throttling and cold-redundancy behaviour behind our intelligent CRPS units.
Explore →
Get the Register Map Before You Commit
Tell us your BMC stack and wattage segment — we will send the command documentation and bring-up procedure with your samples.
Request Command Set